
Converting ESRI Multipatch to simple polygons with GeoPandas
Tue, Oct 8, 2019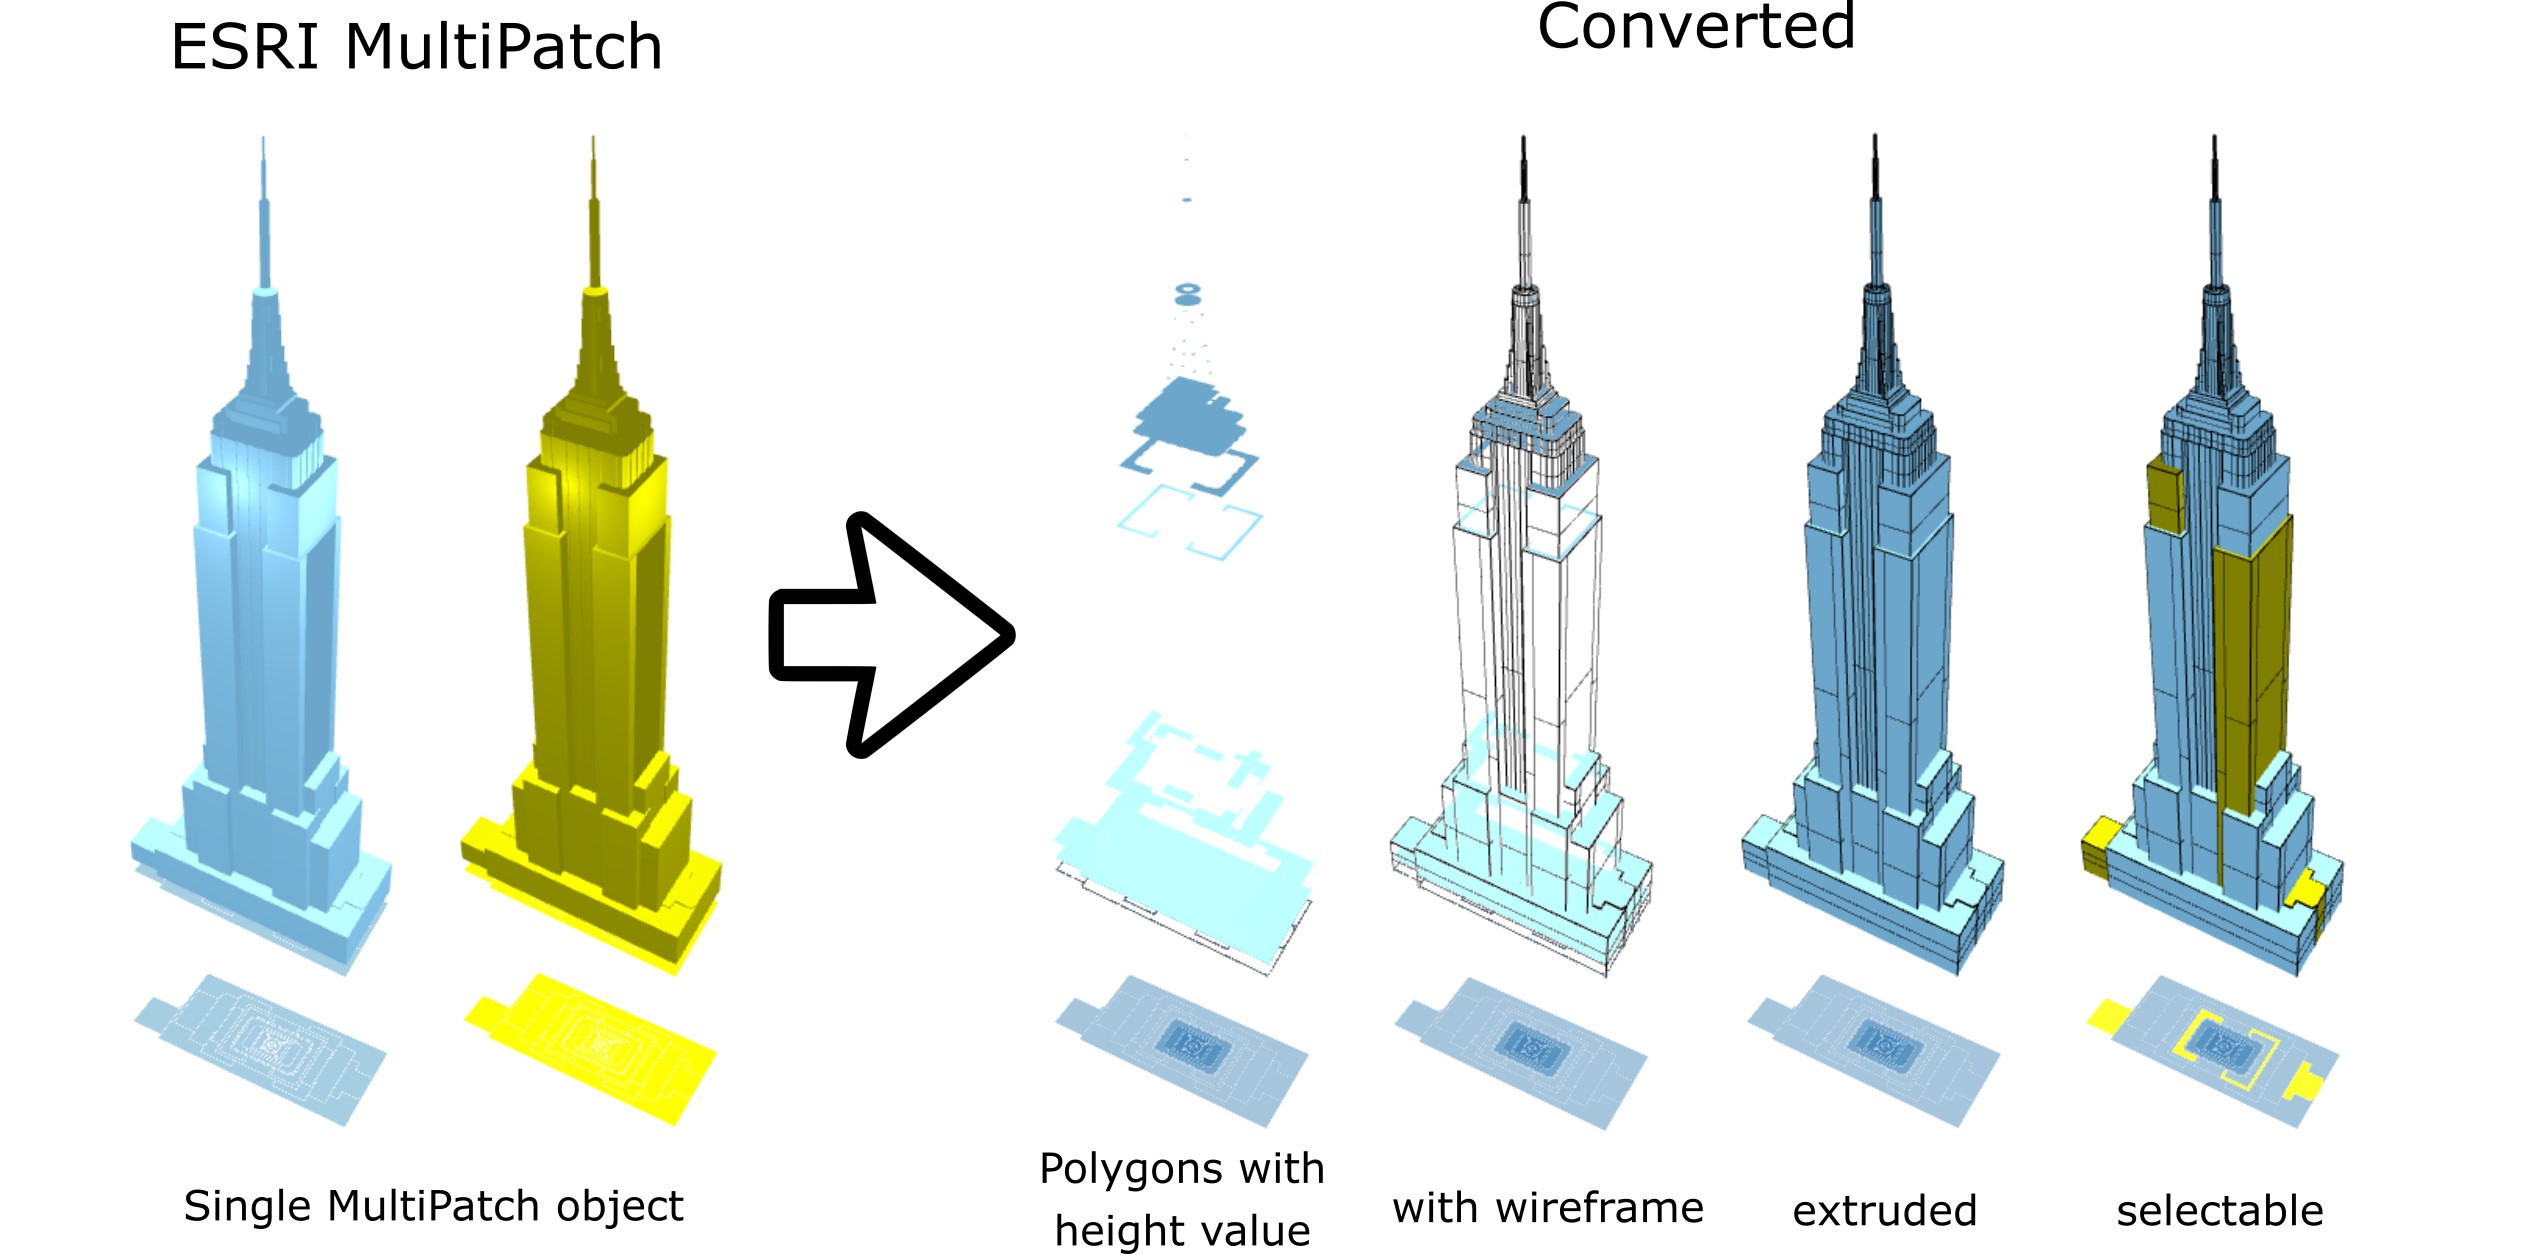
While working on NYC Energy & Water Performance Map for NYC Mayor’s Office of Sustainaility we thought that it would be cool to display actual building shape in 3D rather than just the plain footprint outline. There were already existing efforts trying to accomplish just that such as CesjumJS or OSMBuildings. Since we were already using eneterprise account of Carto as a data server and MapBox as a visualization platform (BTW, they are pretty nicely integrated), we decided to stick with it. Especialy, that MapBox introduced extrusions to display building heights (here is tutorial). They even used NYC data as a showcase. The only problem was that, we needed to edit and interact with this layer in our tool. In this case we decided to build our own city model which could be extruded by MapBoxGL engine.
As a basis for our model I chose NYC 3-D Building Model provided by NYC DOITT. I chose ESRI MultiPatch format.
The multipatch data format, a geographic information system (GIS) industry standard developed by ESRI in 1997, is a geometry used as a boundary representation for 3D objects. A collection that can be made up of triangle strips, triangle fans, triangles, or rings, multipatch features can be used to construct 3D features in ArcGIS®, save existing data, and exchange data with other non-GIS 3D software packages such as Collaborative Design Activity (COLLADA) and SketchUp®.1
The only problem is that MapBox does not support Multipatches with XYZ coordinates. It requires plain 2D polygons defined by XY coordinates and assigned height information, which then can be used as an extrusion value. In order to work I needed to somehow decompose this nested collection of polygons and tease out height value.
ESRI Multipatch conversion with Python
To start we have to import necessary libraries, which are: JSON, GeoPandas and Shapely.
import json
import geopandas as gpd
from shapely.geometry import Polygon
Now let’s load data into GeoDataFrame:
gdf = gpd.read_file('<<path_to_file>>.shp')
or if data is in a GeoDataBase format:
import fiona

gdb_path = '<<path_to_GDB_folder>>.gdb'
gdf = gpd.read_file(gdb_path, driver='FileGDB', layer=0)
Let’s inspect the geodataframe with gdf.head():
| BIN | DOITT_ID | SOURCE_ID | geometry | |
|---|---|---|---|---|
| 0 | 1026874 | 554919 | 1.221000e+10 | (POLYGON Z ((987510.2437957525 219379.82277306… |
| 1 | 1024868 | 441988 | 1.221000e+10 | (POLYGON Z ((988862.4048053324 218144.62806497… |
| 2 | 1082251 | 661695 | 1.221000e+10 | (POLYGON Z ((985535.1129034907 214075.18377606… |
| 3 | 1025013 | 256925 | 1.221000e+10 | (POLYGON Z ((987439.0920351595 216134.57007722… |
| 4 | 1083606 | 118011 | 1.221000e+10 | (POLYGON Z ((985812.2445670813 214483.78302447… |
NYC 3-D Building Model contains the following information:
BIN:       Building identification number. Assigned by City Planning.
DOITT_ID:  Unique identifier assigned by DOITT.
SOURCE_ID: Building shape source identifier.
geometry:  Building shape of `POLYGON Z` type.
Let’s convert gdf into JSON to explore further the structure of the file.
gdf_json = json.loads(gdf.to_json())

In:     gdf_json

Out:	{
		u'type': u'FeatureCollection',
		u'features': [{
			u'id': u'0',
			u'type': u'Feature',
			u'properties': {
				u'BIN': 1015862,
				u'DOITT_ID': 778052,
				u'OBJECTID': 24232.0,
				u'SOURCE_ID': 12210009096.0},
			u'geometry': {
				u'type': u'MultiPolygon',
				u'coordinates': [[[[988042.8900401592, 212057.3518537283, 39.13159999999334],
						   [988086.7987449914, 212136.78279723227, 39.13159999999334],
						   [988105.8548092395, 212126.24902564287, 39.13159999999334],
						   [988336.4960802495, 211998.75288955867, 39.13159999999334],
						   [988455.5286505818, 211932.95282430947, 39.13159999999334]]],
						 ...
						 [[[988194.4550257474, 211942.48266088963, 1163.3408000000054],
						   [988194.0337667465, 211945.5505681485, 1163.3408000000054],
						   [988197.7384837419, 211946.0594253987, 1163.3491000000067],
						   [988198.1597427428, 211942.99151813984, 1163.3491000000067],
						   [988194.4550257474, 211942.48266088963, 1163.3408000000054]]]]}
				}]
		}
We can see it is a FeatureCollection with a list of features. Each feature have the following attributes:
|--- id               - database unique identifier
|--- type             - specified as `Feature`
|--- properties       - all of the attributes stored in GDF columns
|--- geometry         - defines information of
     |--- type        - specified as MultiPolygon
     |--- coordinates - list of Polygons, each containing list of building vertices in [X, Y, Z] format
In order to create MapBox friendly 3D dataset, we basically need to extract each of the nested Polygons as an individual one, assign common properties (identifiers etc.), define its height based on Z value of its vertices and store vertices in [X, Y] format.
# Extract Coordinate Reference System (CRS) of the GeoDataFrame
crs = geodataframe.crs

# Initiate list of features
feature_list = []

# Iterate through features of GeoDataFrame
for feature in gdf_json['features']:
    # Extract properties of each feature
    properties = feature['properties']
    # Flatten MultiPolygons into list of Polygons
    polygon_list = [p for mp in feature['geometry']['coordinates'] for p in mp]

    # Iterate through Polygon list
    for polygon in polygon_list:
        # Create new feature and assign properties to each Polygon
        new_feature = properties.copy()

        # Extract new feature height
        height = polygon[0][2]

        # Assign new feature's height and vertices
        new_feature['height'] = height
        new_feature['geometry'] = Polygon([vertex[:2] for vertex in polygon])

        # Populate polygon list
        feature_list.append(new_feature)

# Create a GeoDataFrame from new features
new_gdf = gpd.GeoDataFrame(feature_list, index=range(len(feature_list)), crs=crs)
The resulting geodataframe has has each row representing single geometry in the form of POLYGON object, with height information derived from Z value of POLYGON Z and same properties for all polygons belonging to the same building.
| BIN | DOITT_ID | OBJECTID | SOURCE_ID | geometry | height | |
|---|---|---|---|---|---|---|
| 0 | 1015862 | 778052 | 24232.0 | 1.221001e+10 | POLYGON ((-73.98631111945986 40.74872415573016… | 39.1316 |
| 1 | 1015862 | 778052 | 24232.0 | 1.221001e+10 | POLYGON ((-73.98550642983119 40.74825243788826… | 1097.9123 |
| 2 | 1015862 | 778052 | 24232.0 | 1.221001e+10 | POLYGON ((-73.98562984699507 40.74828004396161… | 1020.6238 |
| 3 | 1015862 | 778052 | 24232.0 | 1.221001e+10 | POLYGON ((-73.98544763591661 40.74819783458464… | 352.4233 |
| 4 | 1015862 | 778052 | 24232.0 | 1.221001e+10 | POLYGON ((-73.98549904577172 40.74824236299593… | 1073.9225 |
In order to properly display the new data in a visualization platform like MapBox, dataframe needs to be converted into WGS-84 CRS. To do it in Python, just run the follwoing command:
# Convert CRS to WGS 84 (lat and long in degrees)
new_gdf.to_crs({'init':'epsg:4326'}, inplace=True)
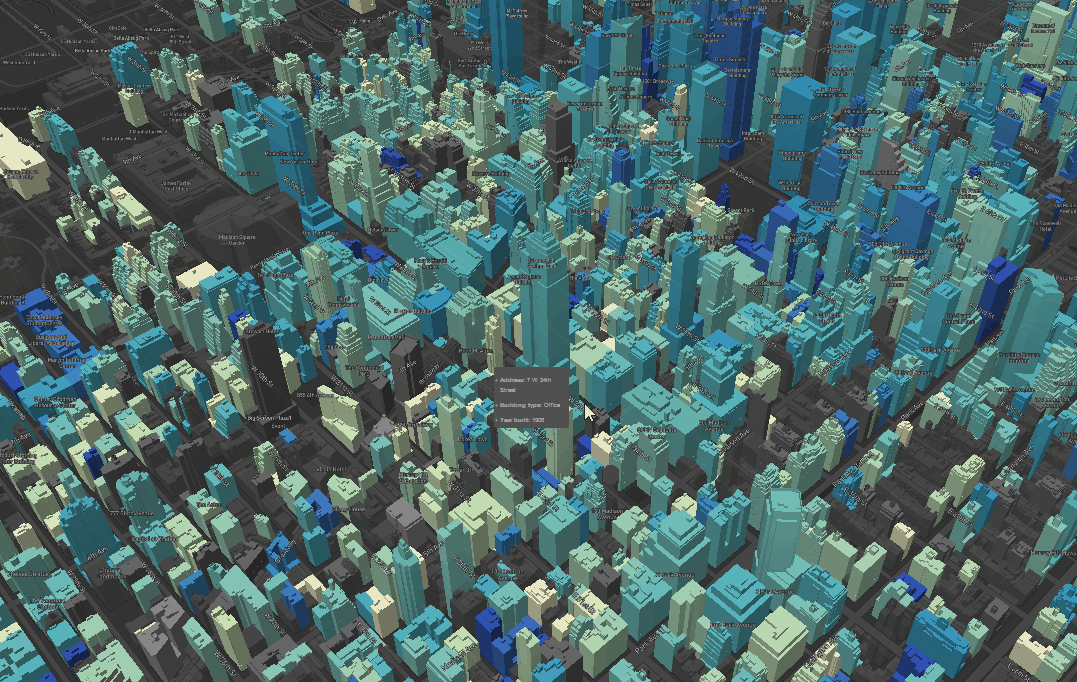
I have created multipatch_converter function automating this process with additional functionality of converting the units, adjusting relative height of the building and saving the output. You can find it on my GitHub account: https://github.com/bbonczak. The results can look like this 3D map of entire New York City with more than 1.2 million buildings:
Back